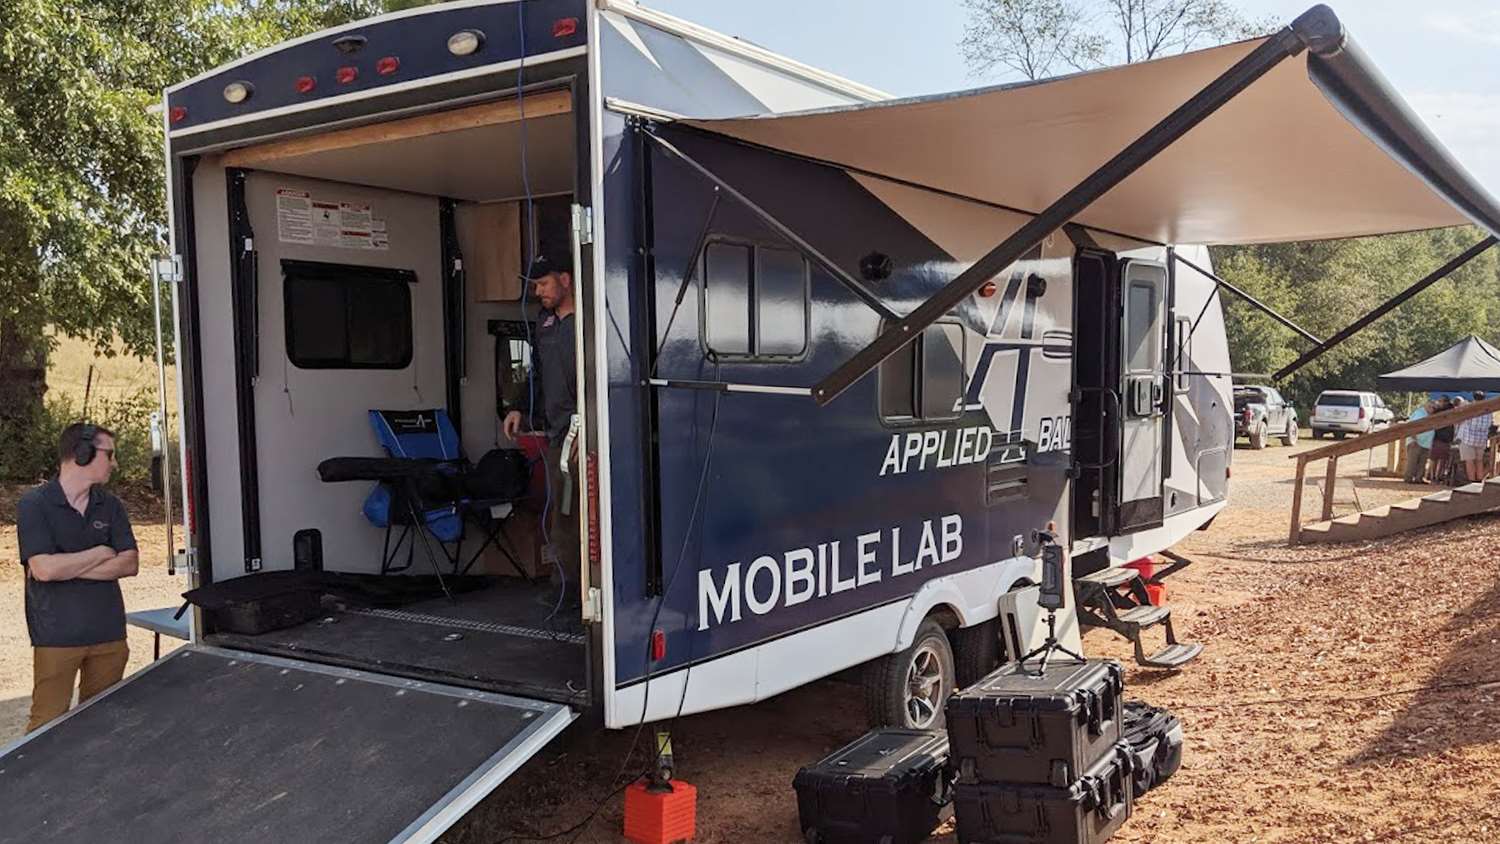
Note: This article is courtesy of our friend Doc Beech, technical support engineer at Applied Ballistics. He said, “At the 2019 Precision Rifle Expo we demonstrated our mobile lab and allowed users to fire their own rifles over our radar to obtain Personal Drag Models.”
Times are changing. The technology in our pockets and the recent portability of scientific equipment has advanced ballistic predictions to a level only dreamt of previously. Not long ago, the standard for computing ballistic solutions was the G1 form factor, which doesn’t remotely resemble the modern low-drag boattail bullet. When it comes to representative models, there are more than a dozen to choose from (e.g., G1, G2, G5, G6, G7, G8, Gsp, Gl, Gi, R4A, etc.). The one most applicable to modern VLD bullets, the G7 Rev. 2, is over 75 years old. When using a proper BC (Ballistic Coefficient), this can provide relatively good firing solutions in the supersonic range. We say “relatively,” because we still have variances between the standard model (G#) and the bullet the user is shooting in supersonic flight. This method should provide sub-MOA accuracy at medium distances (Mach 1.3), but is not ideal for solutions through transonic.
Table 1 shows how the G7 BC changes with velocity. The bullet is a .308-caliber boattail bullet, best represented by the G7 form factor when using BC data. High-resolution Doppler radar systems are capable of measuring exponentially more data points than seen here. A normal test run captures thousands of data points, which has been reduced to 21 points for standard representation. Note of how the BC changes at nearly every point. This is because a BC is only true at a specific velocity and it does change throughout the flight of a bullet, which isn’t a bad thing and is bir representative of a bad bullet. It simply means the bullet has different drag from that of the reference model (G7 in this case), likely due to a difference in the shape of the bullet from the G7 standard projectile. The range in this example is from 0.382 G7 to 0.332 G7 (15 percent change).
When using only BC data, bullet manufacturers take different approaches to provide this information to a consumer.
One method is to publish the highest BC tested, which may not be representative of the bullet’s long-range performance. It just makes the bullet look good on the shelf to the consumer. Another method uses stepped BCs, where BCs from a few different velocities are published to look like a pared down version of Table 1. Stepped BCs were likely the most-accurate approach, providing a drag model that changes with Mach number—until Custom Drag Models (CDM) and Personal Drag Models (PDM) came along.
Applied Ballistics furnishes average BCs from 3,000 to 1,500 fps. This allows for a direct comparison of bullet performance—instead of picking a BC at 2,790 fps for one bullet and at 1,786 fps for another—which wouldn’t allow a fair comparison of the bullets’ performance.
Custom Drag Models
One of the capabilities of our laboratory live-fire testing is the massive amount of data points collected. This data can be plotted to show how the bullet varies from G1 and G7 standard drag models at different velocities as seen in Image 1. Note how widely the G1 varies. This is because we measured a boattailed bullet (G7 design) and not a flat-based bullet (G1 design). Even when looking at the G7 information, it doesn’t form a straight line. The amount of variance in supersonic drag is 5.2 percent in this case. At Mach 1, the transition to subsonic, it has 12 percent variance. Knowing this, which BC is correct for a shooter who is going to transition to subsonic? Do they use an averaged BC for the entire model and accept the minor highs/lows in variance? Do they only shoot in supersonic or subsonic zones? The answer is that the shooter no longer needs to use a BC at all. What you see in the next image is an Applied Ballistics user’s personal rifle and ammunition measured with our radar system—a Personalized Drag Model.
By using CDMs for each bullet, shooters no longer need to reference standard models like G1 or G7. Those variations are a thing of the past. In Image 2, you see the actual drag model for that shooter’s rifle and bullet. The vertical “whiskers” on the plot represent variation from bullet-to-bullet in the 10-shot volley, and the blue line is the average of all 10 shots. With our mobile and base laboratory capabilities a shooter can use PDMs instead of needing a BC. AB Connect allows CDMs/PDMs to populate throughout our ecosystem in a matter of seconds. The entire process takes less than 10 minutes.
CDMs are only different from a PDM in that the bullets were fired from a laboratory rifle and not a user’s rifle. Our library currently has over 850 CDMs, as of October 2019. We generally test multiple twist rates in order to produce a solid average on any given bullet. (If you want to learn more about CDMs, check out this article.)
A PDM means that the user was able to generate a CDM, but they used their own rifle and bullets. Variances in a rifle system (e.g., muzzle brakes, tuners, silencers, 5-groove rifling, 4-groove rifling, gain twist barrels, magazine fed, feed ramps, etc.) have small effects on how the bullets fly out of one rifle vs. another. With a PDM, those variables are directly measured and accounted for. The firing solution can be calculated using the aerodynamic drag model from that user’s system. Even more important, we can provide high resolution data in the critical transition from supersonic to subsonic flight. In the provided PDM example, the transition to subsonic shows that the Coefficient of Drag changes almost 70 percent. This is where the nearly EKG-like bump in the variance plot is observed and is a critical point in firing-solution predictions.
Transonic speed (from about 1,340 fps to 893 fps) is where the drag is most unique for different bullets. Just because a shooter isn’t shooting ELR doesn’t exempt them from needing the transonic data. Rimfire ammunition in some cases starts out around Mach 1.2 and will begin to make the transition long before ELR rimfire distances. Also, some factory ammunition isn’t as fast as handloads. Being as low as 2,550 fps means the bullet can hit transonic within medium- to long-range (600 to 800 yards for some rifles) distances.
CDMs and PDMs eliminate the variation between the bullet’s actual drag and the standard model being used. With the ability to generate these at extremely high resolution, and to do it from a user’s personal rifle/load, we no longer have a need for using G1 or G7 form factors. Instead, we can use a bullet’s own flight model and ditch the BCs. This provides highly accurate firing solutions. We’re already seeing real-world application success with some of the projects coming out of our lab and results from shooting matches. Further, the PDM capability has already been integrated into the Applied Ballistics ecosystem. And, this is only the start. Currently, we are expanding into more products and plan to showcase our mobile laboratory at many events which will result in exponential growth for the capability. Put simply—CDMs and PDMs will soon become the standard.
Shot-to-Shot BC Variation
In Applied Ballistics educational articles, the word “variation” is used in a couple of ways, which brings us to another important subject. Shooters are very familiar with shot-to-shot variation when it comes to muzzle velocity. This variation is documented as ES (Extreme Spread) and SD (Standard Deviation). Muzzle velocity SD can be controlled for handloaders, and when buying factory ammo it can be reduced through purchasing high-quality ammunition. However, there is another SD which has not been addressed in the past, and for the most part is outside of the shooter’s control and ability to measure: the ES and SD of the bullet’s shot-to-shot BC variation.
When computing drag-model data, the general practice of our laboratory is to fire 10 to 15 rounds and then average the performance of those samples to generate the aerodynamic drag model. In some of these images, you can see “whiskers” (called a Whisker Plot). This is the spread from shot-to-shot of the individual bullet’s measured drag. Some of the bullets flew with higher drag, some with lower. This is important information which indicates the vertical dispersion of the bullets at long range. No matter how steady a shooter is, or how low the muzzle velocity SD, he or she will not be able to overcome the bullet-to-bullet drag difference at LR/ELR ranges. The result is a greater vertical dispersion because some bullets are slowing down faster than others. A good match-grade bullet will have a BC SD under 1 percent.
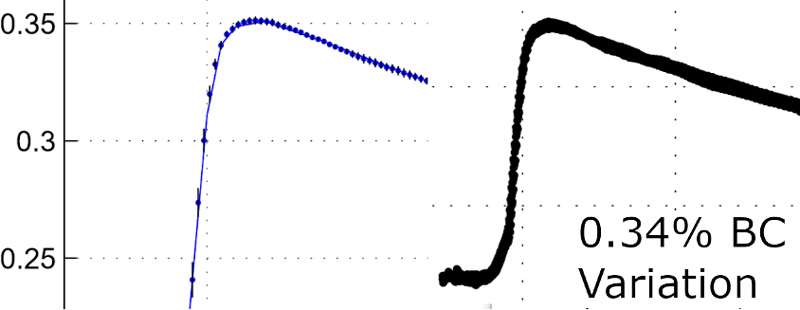
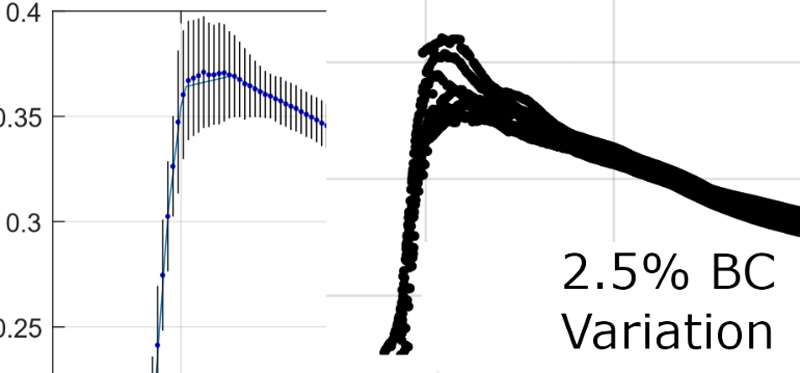
For comparison purposes, we have two bullets which in testing showed 0.34 percent BC variation (Berger 130-grain AR Hybrid) and the other showing 2.5 percent BC variation (.264-cal. 135-grain bullet). The black solid overlays are 10 shots stacked upon each other. The blue overlays are the average performance with SD high/low indication lines (whiskers). Using AB Analytics and inputting the same profile specifications creates a vertical spread of 2.5 inches (0.25 MOA), versus 11 inches (1.1 MOA), respectively from shot-to-shot at 1,000 yards. Since this does not include the rifle system/shooter’s capabilities this results in an uncontrollable 0.25 MOA versus 1.1 MOA spread respectively due to BC variation in the bullets.
BC variation will be covered in far more detail in an upcoming article, but we need to start taking it more seriously as an industry and as shooters.
To learn more, visit www.appliedballisticsllc.com.
All photos and graphics courtesy of Applied Ballistics LLC.
See more: G1 vs. G7 Ballistic Coefficients
Most Popular