Most of us who do a lot of target shooting gradually improve. But all of us, at times, have doubts about it, and sometimes it seems we are actually getting worse. This feeling can take much of the fun out of the sport.
Record your scores
Memory along is a very poor reference. It is easy to remember the good targets and forget the very poor ones. Everyone I know who relies on memory estimates his average higher than it is—then, when he shoots his average starts crying the blues. The only way to know is to make some kind of record.
To save every target would eventually leave you with a mountain of targets, difficult to get the desired information from. A record book is better, but this too has its disadvantages when trying either to get an overall picture or to analyze variations.
The best method is to keep a record and mark the information on a chart. A properly prepared chart shows, at a glance, any trend towards improvement or the reverse. It will easily give control limits which show what scores you may reasonably expect to shoot.
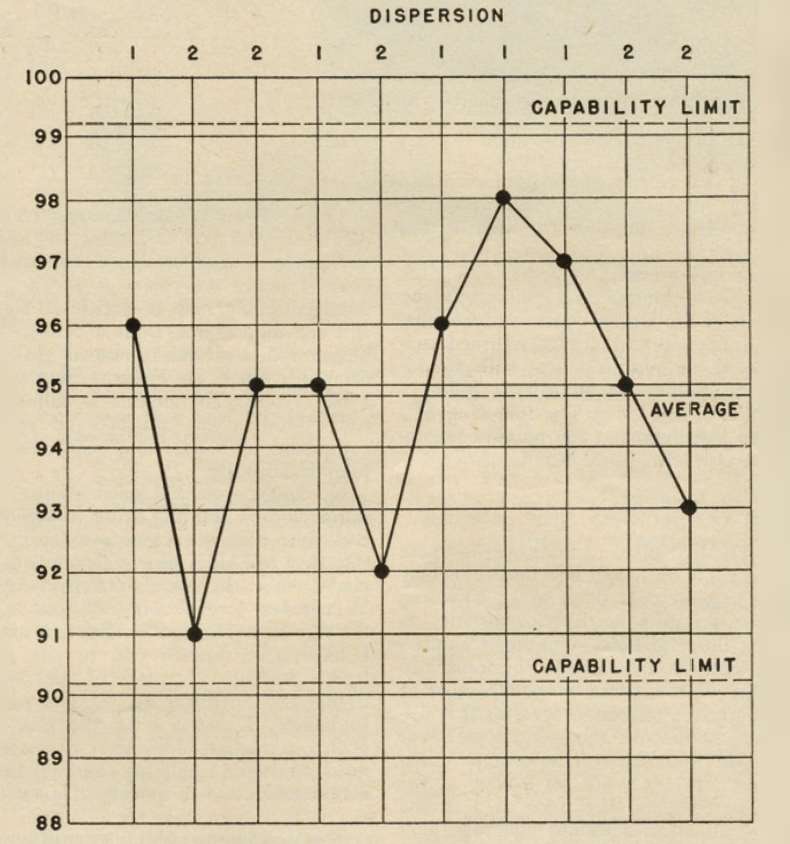
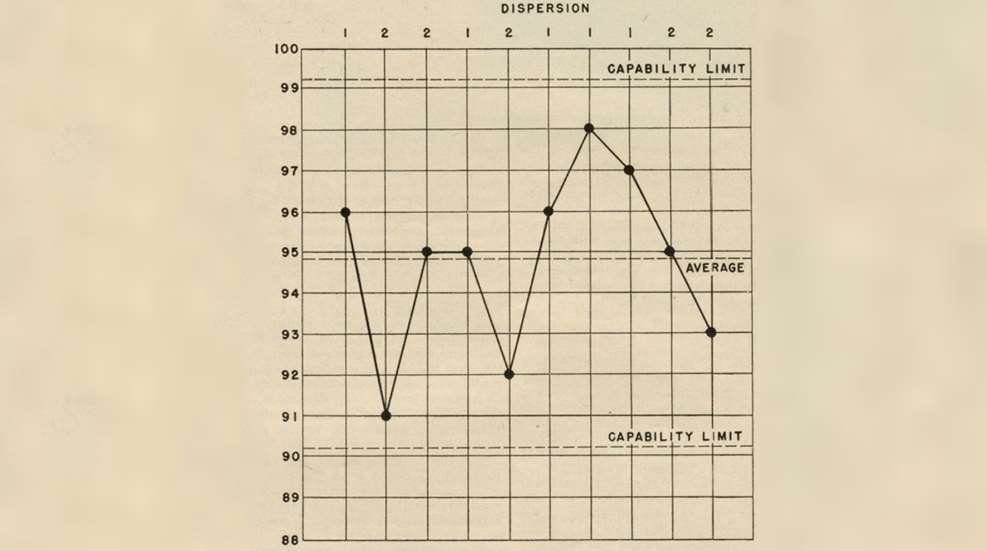
The illustration is a chart I prepared from 10 consecutive targets, shot by one who expected to shoot at least a 96 every time. Anything less called for an alibi. As you can see, his average was just below 95 and he is really as likely to shoot a 94 as a 96.
This was something of a let-down, but later it was mighty comforting to know that when he dropped one into the lower 90s it was merely a natural variation in his own sloppy chance-cause system. The next step, of course, was to attempt to raise the average and narrow the spread in his scores.
The real advantage of charting your scores is in knowing exactly when there is a shift or trend—in other words, when you are getting better or getting worse.
Mechanics of plotting scores
The mechanics of plotting scores on a chart or simple. Use graph paper or make your own lines on plain paper. Number the lines on the left edge, starting with 100 at the top and going lower than you ever expect to score. Every time you score a target, make a dot at the correct level. When the dots are connected with a fine line, the picture becomes clear.
On the illustration you will notice that, in addition to plotting the scores and their average, I have noted the dispersion shown by each target. This is necessary for calculation of the limit lines, as explained later. The dispersion figure is simply the difference between the smallest point and the largest point on a target. For example, if all the shots on a target are 9s and 10s, the dispersion is 1. If the lowest point on a target were a 6 and the highest a 9, the dispersion would be a 3.
To make the whole plan statistically sound, these rules must be followed:
- Each chart must show only one type of shooting—one gun, one range and essentially the same general conditions.
- All targets shot under these conditions must be recorded.
- The procedure outlined here and the formula expressed will apply only to 10 shots on a 100-possible target.
Any changes which you feel might affect the score (equipment, ammunition etc.) should be noted on the chart at the point they occurred, for consideration when a shift is observed.
After a minimum of 10 plottings (more is desirable), the average line and the capability limits may be drawn in. The average is computed by adding all the scores together and dividing by the number of scores. In the illustration, we have plotted 96, 91, 95, 95, 92, 96, 98, 97, 95 and 93 for a total of 948. We divide by 10 since there were 10 of these scores, and draw the average line at 94.8.
Establishing limits of capability
The capability limits are developed by multiplying the average dispersion by 3. In the illustration we have posted the dispersions as 1, 2, 2, 1, 2, 1, 1, 1, 2 and 2 for a total of 15. Again we divide by 10 since there were 10 dispersions, and arrive at the average 1.5. This is multiplied by 3 which puts the capability limits 4.5 points above and below the average. The factor 3 is sufficiently precise for our purposes, but remember it applies only to targets of 10 shots each, not to targets of any other number of shots.
After the average and limit lines have been drawn, continue to plot all scores shot. When a shift or trend is observed an effort should be made to discover the cause. It is just as important to investigate the cause of a sudden upward trend as a downward one, to discover what was responsible for the improvement. Generally speaking, when 3 consecutive targets score closer to the capability limit (either upper or lower) than to the average, or 5 consecutive targets score on the same side of the average, it bears investigation.
This is a modification of the chart which has become one of the principal tools of statistical quality control in modern industry. The accepted theory is that when dispersion is governed by chance alone, assignable causes having been removed, then over 99 percent of the plottings should fall within the limit lines. The system thus shows whether a process is operating to the extent of its ability, for everything from filling jars of cold cream to manufacturing delicate watch parts.
It should be pointed out that 10 plottings, as shown here, would be considered by many statisticians as too few on which to base definite conclusions. As a matter of fact, later recordings on the illustrated chart showed a good improvement and a more normal distribution, but I like to think this was partly due to the psychological effect.
Your chart will show what you really can do. You might hang it on the wall over that perfect target you shot.
The author, Tom Riley of Lincoln, Nebr., at the time of this article was the supervisor of statistical quality control at Elgin National Watch Co., Lincoln Division.
Most Popular